
If you ask the average investor which month is the most volatile for the stock market, they will probably say October. It’s a reasonable answer, but it’s incorrect.
Despite October’s reputation for market-defining events like the crash of 1929 that led to the Great Depression, Black Monday’s drop in 1987, and the federal bank bailout at the start of the Great Recession in 2008, over the last 25 years, September returns on the Standard & Poor’s 500 stock index have been worse.
This phenomenon has become known as the “September Effect.” And as you can see in the chart below, this isn’t just a U.S. market anomaly but a global trend that has affected stock markets worldwide.
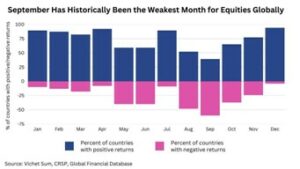
With September upon us, we wanted to discuss the September Effect and assure you that your investment strategy takes into consideration that there will be periods of market volatility.
We also want to remind you that the S&P 500 Composite Index is an unmanaged index that is considered representative of the overall U.S. stock market. Index performance is not indicative of the past performance of a particular investment. Past performance does not guarantee future results. Individuals cannot invest directly in an index. The return and principal value of stock prices fluctuate as market conditions change. When sold, shares may be worth more or less than their original cost.
The September Effect Could Have Multiple Causes
Ask four market strategists what causes the September Effect, and you’ll likely get four different opinions. And while statistics show that September is more volatile, much of the theory about the September Effect is anecdotal.
Here are a few:
- Election Season—September usually begins the U.S. election cycle, which can cause investors to reposition their portfolios if they anticipate a power shift in Washington, D.C. While the September Effect isn’t limited to U.S. markets, U.S. elections can have a ripple effect worldwide. With the midterm election behind us, and the 2024 presidential election a year off, the impact of the election may be more muted this year.
But politics may still play a role this year. Both the House and the Senate will return from their August breaks and will have a few weeks to try to pass spending bills before the end of the current fiscal year on September 30. There may be some headline impact in September regarding the risk of a government shutdown on October 1. Markets may react as they did during the debt ceiling negotiations earlier this year.
- Seasonal Rebalancing—At the end of summer, children return to school, vacations end, and investors start to position themselves for the final quarter. Trading volume tends to pick up in September as portfolio managers look to the new year. In addition, institutions and other large investors may need to update their portfolios for year-end reporting. This extra layer of trading can lead to an upswing in volatility.
- Market Psychology—While market psychology and investor sentiment are hard to quantify, they may be among the likeliest causes of the September Effect. Stocks may be volatile in September because investors expect them to be. The follow-the-herd mentality is hard to resist, especially for some investors. As a result, the September Effect can become a self-fulfilling prophecy.
Wall Street Maxims
If stocks drop this month, it will be another data point to bolster those who believe in the September Effect. But should you use that belief or other well-known stock market folklore to improve your investment returns? History says no.
Some investors swear by Wall Street adages, like “Sell in May and go away,” “Don’t fight the Fed,” and “Never try to catch a falling knife.” The problem is that many clichés revolve around trying to time the markets.
One investment saying that has merit is “It’s time in the market, not timing the market.”
A landmark study by Dalbar (2023) showed that equity investors posted an average annualized return of 6.81% for the 30-year period ending on December 31, 2022. While that may sound strong, it’s far below the 9.65% return of the Standard & Poor’s 500 Index for the same period. Put into dollar terms, after 30 years, an investor’s original investment of $100,000 increased to almost $722,000, but the same investment in the S&P 500 would have been worth nearly $1.6 million, or more than double.
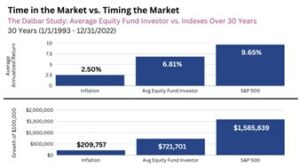
Dalbar’s Quantitative Analysis of Investor Behavior Report, 2023: April 3, 2023. The Standard & Poor’s 500 stock index is not indicative of the past performance of a particular investment. Individuals cannot invest directly in an index. The returns and principal values of stock prices will fluctuate as market conditions change. Shares, when sold, may be worth more or less than their original cost.
This illustration is an example of what can happen over the long term. Remember that it’s unlikely that a portfolio would be a 100% investment in the S&P 500, which is an unmanaged index considered to be representative of the overall U.S. stock market.
The study concluded by noting, “Often succumbing to short-term strategies such as market timing or performance chasing, many investors lack knowledge and/or ability to exercise the necessary discipline to capture the benefits markets can provide over longer time horizons. In short, they too frequently react to market maturations and lower their longer-term returns.”
Bottom line: an individual can be their own worst enemy when it comes to investing. Remember, when you time the market, you have to be correct twice—once when leaving the market and once when deciding to reinvest.
The Cost of Missing the Market’s Best Days
During a year like 2022, with markets down by double digits, it’s understandable that some investors were concerned about their overall strategy, but sitting on the sidelines can often mean missing the market’s best days.
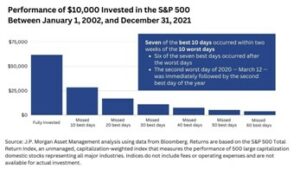
According to a study by J.P. Morgan, a $10,000 investment in the S&P 500 on January 1, 2002, grew to $61,685 by December 31, 2021. However, sitting in cash and missing out on just the ten best days over those 20 years, the value would have been cut by more than half, to $28,260. Miss the best 20 days, and the value would drop to only $16,804. Of course, past performance is no guarantee of future results.
Performance of $10,000 Invested in the S&P 500 Between January 1, 2002, and December 31, 2021
Stick with Your Strategy
Market timing is a challenge because some of the most significant gains happen when you would least expect them, while some of the worst days occur when everything seems to be going great. We would all love to miss the worst market days, but it’s difficult to avoid them and still capture the best ones.
So, don’t get wrapped up in thinking about things you can’t control, like the September Effect. Your investment strategy reflects your goals, time horizon, and risk tolerance, and our approach takes market fluctuations into consideration. History has shown that successful investing requires discipline, patience, and an ability to manage risk. When volatility enters, emotions and investment risks run high. It can be easy to lose focus on your investment strategy.
To assist with your long-term financial plan, contact Outlook Wealth Advisors at info@outlookwealth.com or by calling 281.872.1515